


Power monitoring and management system
Breif introduction:
1. The power monitoring and management system of Shenzhen Dayi Electrical Industrial Co., Ltd. mainly provides real-time power monitoring and management solutions for domestic medium and low-voltage power distribution system and consumption networks. The system plan covers:
1) 10kV / 35kV substation integrated automation system.
2) Intelligent monitoring background system of distribution network switch station.
3) Coordination, scheduling and control platform for power demand.
2. The system is based on idea the internet of things. All electrical instruments, switches, temperature and humidity instruments, industrial control components, etc. in the machine room are intelligent and have their IP addresses, realizing the "interconnection and interworking of all things" of various equipment, facilities, instruments, E-Cs, background operation client and relevant superior command / dispatching departments in the substation and machine room.
3. This system not only solves the traditional remote real-time meter reading problems (including "three-phase voltage, current, power, power factor, frequency, electric energy, temperature, switch position, equipment operation status, etc.), but also solves problems of the backstage’s active management to the front-end substation and machine room (management problems include" front-end machine room microcomputer protection, distribution and power balance intelligent coordination , computer room real-time security monitoring, etc.).
4. Dayi's power monitoring management system based on cross platform technology developed and core products such as configurable two-way communication front industrial router, provides the overall solution of distribution network monitoring management.
5. The system is divided into two versions: network version and stand-alone version.
The network version is to build a distributed network structure by using each node distributed in the industrial network. The software supports the redundant setting of dual networks, and meets the requirements of various large and medium-sized high and low-voltage transformation and distribution rooms, small and medium-sized transformation and distribution system, building automation, computer room monitoring, solar power station monitoring system and other integrated systems.
The stand-alone version is suitable for small-scale monitoring system, which meets the requirements of data acquisition, equipment control and output, process control, animation display, engineering report, data and curve, etc.
The front-end data acquisition and two-way communication intelligent hardware (Industrial router) and server management software involved in the system scheme are standardized, with friendly and easy user-friendly interface, and system deployment process also features standardized. The overall system software is convenient for deployment, implementation and later expansion of the project, and can also be customized according to the needs of customers. At present, the system scheme has been applied to many industry customers, such as culture and tourism industrial park, chemical industry, commercial bank, etc., and have gained approval and trust from our customers.
System scheme structure
1. System topographic map. Based on the general industrial characteristics of power monitoring in medium and low voltage distribution stations and switchyards in China, and in combination with the development trend of the Internet of things, we propose a targeted and moderately advanced system design scheme. The system structure topology is as follows:
Topographic map

The system scheme includes four layers:
The first layer is "data acquisition layer".All kinds of sensors (supporting 485, TTL and other serial port protocols) are embedded and installed on the electric instruments and meters, microcomputer relay protection, intelligent switch, fault and wave recording equipment, temperature and humidity meter, DC screen, anemometer, IP camera, inspection robot, intelligent fire AGV, etc. in the machine room. The sensors will be coded and compressed after the original collection. The encoded and compressed data is collected by the front industrial router according to the IP / TCP protocol to form "data" and transmitted to the background through standard Ethernet.
The second layer is "Internet of things communication layer",including LAN and WAN (Internet).
The collection equipment and control equipment of each area and each machine room are connected to the local LAN through the industrial router. The stand-alone power monitoring system can be applied to the local area network to meet the requirements of data collection, equipment control and output, process control, animation display, engineering reports, data and curves, etc. the relevant data can be recorded and stored in the local area network server supporting post event data retrieval, replication or management. But it does not support remote viewing and remote real-time monitoring.
The collection equipment and control equipment of each area and each machine room can transmit Internet data through industrial router, optical fiber or 2g3g4g5g network. The network version of the power monitoring system adapts to the Internet, and uses each node distributed in the industrial network to build a distributed network structure. The software supports the redundant setting of the dual network, and meets the requirements of various large and medium-sized high and low-voltage transformation and distribution rooms, small and medium-sized transformation and distribution, building automation, computer room monitoring and solar power station monitoring systems. The data transmission of manual instructions or intelligent instructions from server or client to collection equipment and control equipment in each computer room supports two-way communication, that is, the so-called "interconnection of all things".
The third layer is "server layer" which mainly includes management server, database server and storage server. According to the size and needs of customer projects, they can be deployed on the third-party cloud servers (such as Alibaba cloud, Tencent cloud, Lenovo cloud, Google cloud, etc.), or they can build their own server rooms. The functions of the server mainly include: various asset management, personnel hierarchical account and password management, operation log recording, providing graphical presentation effect, operation data statistical analysis, generating various forms, fault information collection, fault reproduction, remote fault processing, remote control instruction release, historical data storage and copy review, waveform analysis, operation management and other functions.
The fourth layer is "operation and management client layer".Server administrators, business administrators at all levels, operators at all levels and relevant superior command and dispatching personnel are able to carry out business operation and operation data monitoring and management within their authorized scope through web, mobile app, we-chat applet and other ways at PC end and smart phone end.
Summary of data collection
There are many ways for software to communicate with external intelligent devices, such as serial port, network, etc. Serial port is a very general communication protocol of equipment on computer. Serial port is also a general communication protocol for instruments and meters; serial port communication protocol can also be used to obtain data of remote acquisition equipment.
The software communicates with the intelligent instrument or PLC through the IO communication driver, so that the running parameters of the actual hardware equipment can be monitored in real time by the computer. The communication driver is developed by the software according to the communication protocol of the equipment, so as to collect the parameters of the equipment.
Hardware equipment supported by software includes: PLC, intelligent module, board card, intelligent instrument, high voltage protection, frequency converter and other hardware equipment used in industry. Engineers only need to select the connection mode of the device in the device library of the software, and then complete the configuration step by step according to the prompt of the "channel configuration wizard". The configuration process of the driver is more convenient and quick.
Data variable in software is the basic unit of real-time database, also known as database variable. Registers in corresponding communication intelligent instruments and other devices are also defined as variables, which are called device variables in software. In the software, we can't use the device variables directly, but we need to associate the device variables with the database variables first, and then monitor the device variables indirectly by using the database variables.
Introduction to some functions and displays of system software
1. Menu configuration
This function can load classied files and graphic files required by the project, as shown in the following figure:

Select a group / item and right-click to pop up the selection menu, where you can add the same level menu, sub-menu, modify group / item, delete group / item and copy group / item. At this time, it should be noted that if you delete a group, all sub-menu in the group will be deleted.
2. Application data configuration
It is used for the configuration of application data such as rate, equipment account, load, team, power consumption unit, power standard, etc.
1) Equipment account: the equipment account is the main basis to reflect the ownership, distribution and change of various types of equipment of the power user. Its contents include: equipment name, model, specification, type, unit of measurement, inventory, replacement cycle, latest replacement, maintenance time, manufacturer, supplier, etc., which are made in the form of tables to facilitate the update and inventory of equipment.
2) Rate configuration: it can provide advanced and reliable metering configuration for three-phase time-sharing billing.
3) Load configuration: the sum of the electric power taken from the power system by the electric equipment of the electric energy user at a certain time, which is called the electric load. Load configuration is conducive to the priority of the unit to ensure the key load of power supply, so as to achieve the role of electricity safety and saving.
4) Team configuration: before the power supply and utilization facilities are put into operation, the power consumption unit shall establish and improve the power utilization management organization, organize the operation, maintain the professional team, and clarify the responsibilities of the management organization and the professional team.
5) Power consumption unit configuration: associate the equipment with the power consumption unit to facilitate the management of the unit.
6) Reasonable power consumption configuration: reasonably arrange the electric equipment, set the use time, energy consumption, and achieve the role of energy conservation and emission reduction.
7) Standard configuration of electric energy: no rules, no circles. Standards are deeply rooted in people's hearts. All walks of life have their established norms and standards. The so-called know your own and know your other can win every battle, know the industry, domestic and even global standards, and standardize yourself with standards, which is conducive to the long-term development of the unit.
3. Types of events

1) Over limit alarm: an alarm event generated by exceeding the limit value, such as over temperature and over pressure alarm.
2) Displacement alarm: the alarm of the equipment switch. If the equipment light changes from on to off, an alarm event will occur.
3) Fault alarm: when the equipment fails, the equipment will generate an alarm event; when the system and equipment are interrupted, the fault event will occur.
4) User operation event: the event of user operation, such as user operation event when the user logs in.
5) System event: system event will be generated when the system exits or starts.
6) SOE event: record the time when the fault occurs and the type of event, such as what kind of fault occurs in XX minutes XX seconds XX milliseconds of a switch.
7) Remote signaling deflection: the status of remote signaling changes (from opening to closing or from closing to opening).
8) Event record: record any event occurred in the running state of the system.
9) Operation record: records the user's operation events in the process of system operation in editing or running state.
10) Fault briefing: in the running state, if any fault event occurs, the system will default to the user to prompt where there is a problem.
11) Fault report: provide complete fault events of the system to users or system engineers.
12) Wave recording message: the wave recording management first records the events and behaviors of the equipment, and then gives an event report based on the data.
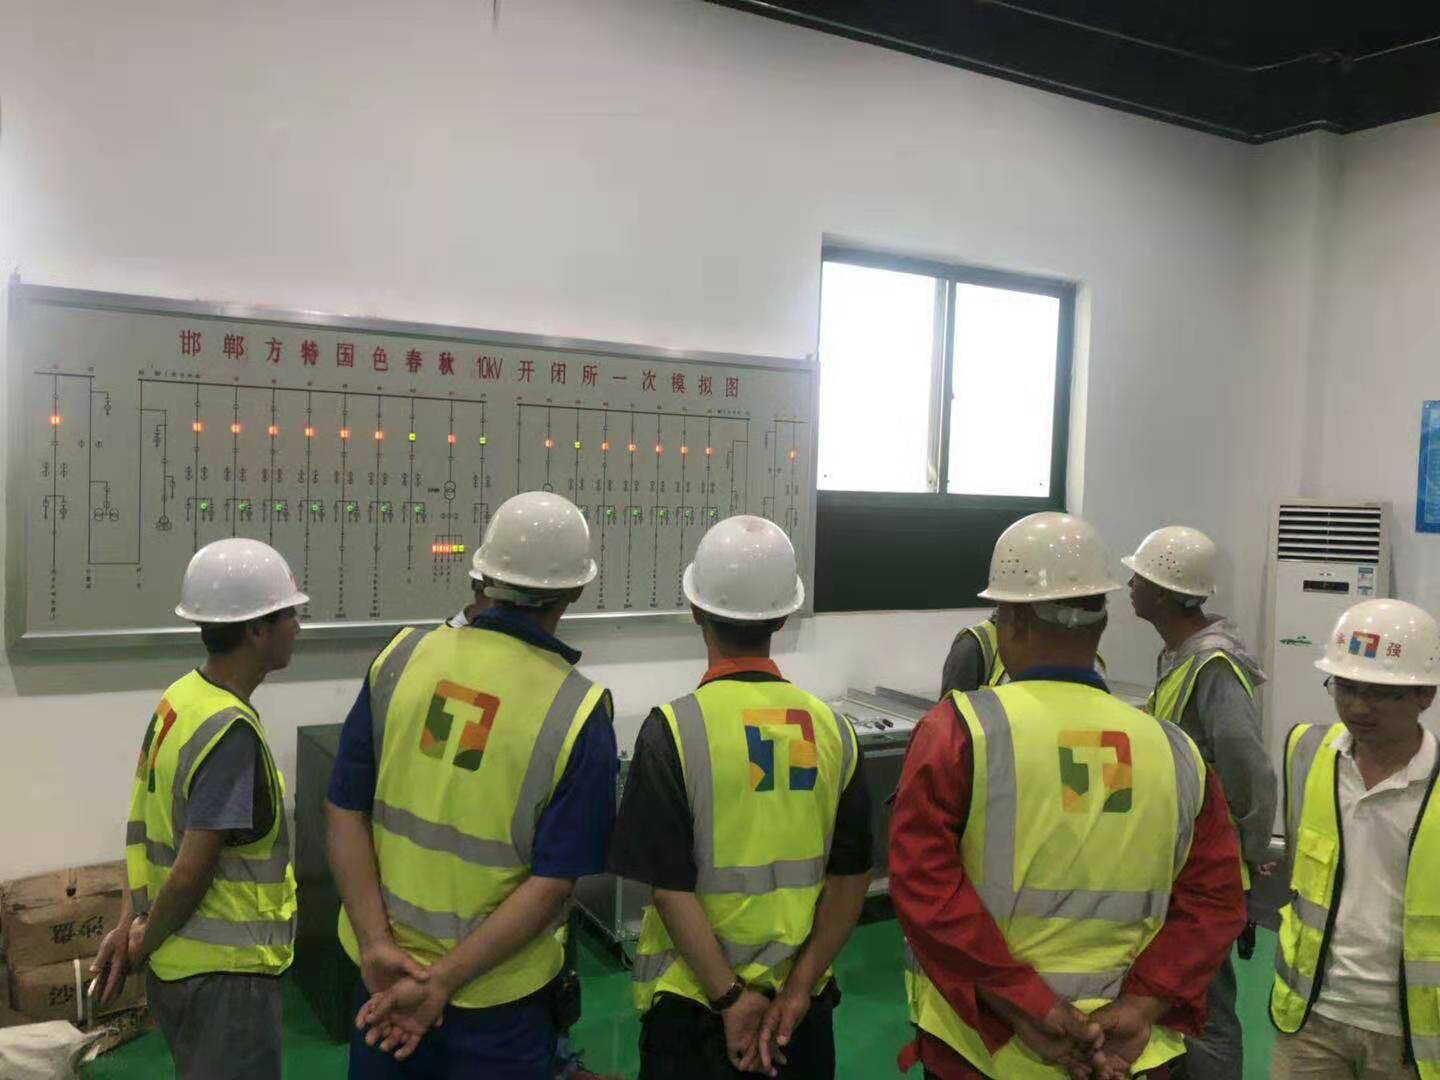
4. Actual project application interface reference

……